

Blickmuster: Untersuchung von Strategien beim Umgang mit indirekt proportionalen Funktionsgraphen im ther-modynamischen Kontext
Autor/innen
Dateien
Abstract
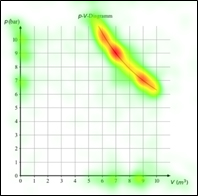
Die Unterscheidung mathematischer Funktionen ist entscheidend für das Verständnis komplexer Konzepte in Mathematik und Physik. Besonders die Differenzierung von Graphen indirekt proportionaler und anderer Potenzfunktionen stellt viele Lernende vor Herausforderungen, die sich in den Strategien der Lernenden widerspiegeln. Diese Studie untersuchte das Blickverhalten von 80 Zehntklässler*innen bei der Identifikation isothermer Zustandsänderungen in p-V-Diagrammen. Mithilfe von Eye-Tracking und retrospektiven Interviews wurden zwei Strategien identifiziert: der Fokus auf Wertepaare, bei dem Druck- und Volumenwerte verglichen werden, und der Fokus auf den Funktionsgraphen, bei dem der Kurvenverlauf analysiert wird. Lernende, die sich auf Wertepaare konzentrierten, zeigten vorwiegend horizontale und vertikale Blickbewegungen, während der Fokus auf den Funktionsgraphen mit diagonalen Blicksprüngen einherging. Viele Lernende fokussierten sich beim Betrachten des Funktionsgraphen jedoch auf irrelevante Aspekte, wie die Lage der Kurve, was zu Verwechslungen zwischen isothermen und adiabatischen Zustandsänderungen führte. Die Ergebnisse liefern wichtige Hinweise für die Entwicklung adaptiver Lehrmethoden, die an die spezifischen Strategien und Blickbewegungsmuster der Lernenden angepasst sind, um das Verständnis thermodynamischer Funktionsgraphen zu verbessern.
Literaturhinweise
[1] Fehlinger, P., Becker-Genschow, S. & Watzka, B. Gaze behavior as a key to revealing strategies for identifying indirectly proportional graphs in thermos. dynamic and mathematical context. Phys. Rev. Phys. Educ. Res. 21. 020129. https://doi.org/10.1103/4pn3-fs4y DOI: https://doi.org/10.1103/4pn3-fs4y
[2] Adila, A. S. D., Sutopo & Wartono (2018). Students' reasoning in analyzing temperature from PV diagram representing unfamiliar thermodynamics process. Journal of Physics Conference, 1097(1), 012012. https://doi.org/10.1088/1742-6596/1097/1/012012 DOI: https://doi.org/10.1088/1742-6596/1097/1/012012
[3] Saepuzaman, D., Sriyansyah, S. P. & Karim, S. (2019). Unpacking Pre-service Physics Teachers' Understanding of the PVT Diagram and the Associated Mathematics. Journal of Physics Conference Series 1204, No. 1, 012032 https://doi.org/10.1088/1742-6596/1204/1/012032 DOI: https://doi.org/10.1088/1742-6596/1204/1/012032
[4] Ostermann, A., Leuders, T. & Nückles, M. (2018). Improving the judgment of task difficulties: prospective teachers' diagnostic competence in the area of functions and graphs. Journal of Mathematics Teacher Education, 21, 579-605. https://doi.org/10.1007/s10857-017-9369-z DOI: https://doi.org/10.1007/s10857-017-9369-z
[5] Fermi, E. (2012). Thermodynamics. Courier Corportion.
[6] Pinker, S. (1990). A theory of graph comprehension. In R. Freedle (Hrsg.), Artifical intelligence and the future of testing (S. 73-126). Erlbaum.
[7] Unema, P. J. A., Pannasch, S., Joos, M. & Velichkovsky, B. M. (2005). Time course of in formation processing during scene perception: The relationship between saccade amplitude and fixation duration. Visual Cognition, 12(3), 473-494. https://doi.org/10.1080/13506280444000409 DOI: https://doi.org/10.1080/13506280444000409
[8] Klein, P., Hahn, L., & Kuhn, J. (2021). Einfluss visueller Hilfen und räumlicher Fähigkeiten auf die graphische Interpretation von Vektorfeldern: Eine Eye-Tracking-Untersuchung. ZfDN, 27, 181-201. https://doi.org/10.1007/s40573-021-00133-2 DOI: https://doi.org/10.1007/s40573-021-00133-2
[9] Kiili, K., Ketamo, H., Koivisto, A., & Finn, E. (2014). Studying the user experience of a tablet based math game. International Journal of Game-Based Learning (IJGBL), 4(1), 60-77. https://doi.org/10.4018/IJGBL.2014010104 DOI: https://doi.org/10.4018/IJGBL.2014010104
[10] Guan, Z., Lee, S., Cuddihy, E., & Ramey, J. (2006, April). The validity of the stimulated retrospective think-aloud method as measured by eye tracking. In Proceedings of the SIGCHI conference on Human Factors in computing systems (pp. 1253-1262). https://doi.org/10.1145/1124772.1124961 DOI: https://doi.org/10.1145/1124772.1124961
[11] Thomaneck, A., Vollstedt, M., & Schindler, M. (2023). Eye-Tracking und Stimulated Recall Interviews zur Strategieanalyse bei der Erfassung der Änderung von Graphen.
[12] Ward, J. H. (1963). Hierarchical grouping to optimize an objective function. Journal of the American Statistical Association, 58 (301), 236-244. https://doi.org/10.1080/01621459.1963.10500845 DOI: https://doi.org/10.1080/01621459.1963.10500845
[13] Kuckartz, U. (2019). Qualitative text analysis: A systematic approach. In G. Kaiser & N. Presmeg (Eds.), Compendium for early career researchers in mathematics education (pp. 181-197). Springer. https://doi.org/10.1007/978-3-030-15636-7_6 DOI: https://doi.org/10.1007/978-3-030-15636-7_8
Downloads
Angaben zum Artikel


Lizenz
Copyright (c) 2025 Paula Fehlinger, Sebastian Becker-Genschow, Bianca Watzka

Dieses Werk steht unter der Lizenz Creative Commons Namensnennung 4.0 International.